Cool Cartographic Maps!
- Sep 22, 2020
- 1 min read
A few months ago I undertook the ESRI Cartography MOOC!
As a very visual person, with a strong interest in design, this course was a fusion of my favourite two worlds; GIS and ART = Cartography. I had undertaken a Cartography class last year during my Masters Study, you can see some of the maps made here, and I knew that I'd love to learn more about Cartography.
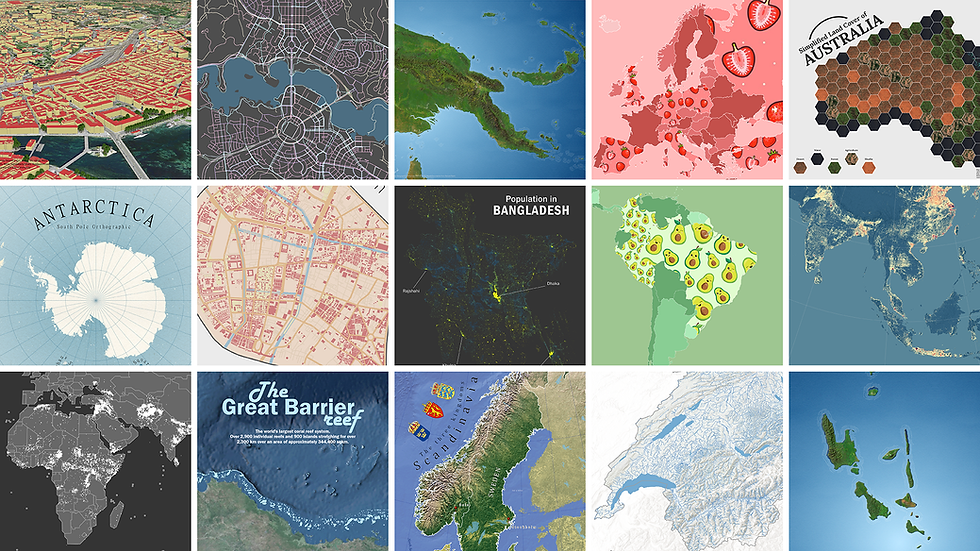
Throughout the 6 week module, we went through many different types of Cartographic principles and learnt new techniques. I experimented with different symbology and styles and created quite a few cool maps! You can check them out below. All data was provided by ESRI through the MOOC.
Jackson Pollack Inspired Map of the UK 2018 Election Results
This was one of the most fun maps I made during the MOOC. The artistic style was really fun to create and made a map that people aren't really used to seeing. Is it crisp and very readable? Not sure, but is it fun and interesting to look at? YES.

Sketch Map Style in Boston
This map was created using the sketch map style by John Nelson.

Small Multiples Layout of Earthquakes around the World

A Polar Projection of Hurricanes
This map really changes the perception of the viewer by switching the map projection. The high contrasting colours chosen really illustrate areas of high frequency for hurricanes, or as we call them down under, cyclones!

INFORM Risk Index Choropleth Maps
As apart of my mapping project, I created some additional choropleth maps of the INFORM Risk Index.


Comments